
Ophthalmic Imaging in Common Retinal Conditions:
Advancing How We See the Eye
By Keyvan Koushan, MD, FRCSC
In contrast to most organs, the eye can be studied and visualized at different levels. The imaging modalities of the retina and choroid have been expanding steadily, enabling us to learn more about the structure and function of these tissues. These advances in technology have led to better understanding of various retinal diseases. This issue of Ophthalmology Rounds gives an overview of the most commonly used imaging tools in the field of retina, and briefly discusses their application in a number of common retinal diseases.
Various Retinal Imaging Modalities
Fundus photography
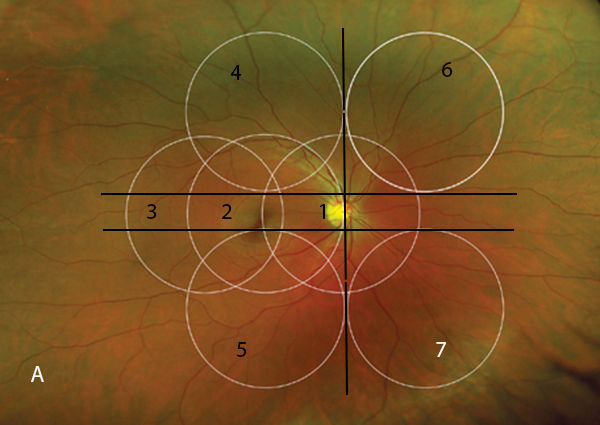
First introduced by Jackman and Webster in 1886,[1] fundus photography has become an essential component of retinal evaluation and documentation. Fundus cameras utilize light flash illumination and principles of indirect ophthalmoscopy to record retinal images. Light is generated by a viewing lamp or electronic flash. It then passes through a series of filters and mirrors and is shaped into a doughnut configuration (ie, the central portion is not illuminated). This doughnut of light is then reflected off the retina. With correct camera alignment, the reflected light will pass through the centre of the illuminating doughnut and is recorded by a film or digital camera.[2] The viewing angle of most fundus photography cameras ranges between 30° and 50°. Images with a 45° to 60° field of view are generally referred to as wide-angle images. The standard 7-field fundus photography is used primarily in clinical trials and uses 7 images of 30° each to capture a wider fundus view (Figure 1). Ultra wide-angle images are obtained using the newer laser-based cameras and capture images up to 200° wide. These cameras use different wavelengths of laser light to obtain multiple images and then recreate the colours in the final image. This technique has been shown to have very good diagnostic agreement with 7-field standard stereo photographs and clinical examination in the setting of diabetic retinopathy (DR) or pigmented choroidal masses.[3,4]
Monochromatic retinal imaging
Vogt described the use of green light to enhance visualization of ocular fundus and termed it “red-free.”[5] This technique uses different reflectance properties of fundus layers to enhance visualization of certain fundus structures using monochromatic illumination using filters. Blue, green, or red filters are commonly used for this imaging modality and each provides enhanced contrast for specific fundus structures. For instance, the green light (also known as “red-free”) is partially reflected by the retinal pigment epithelium (RPE) and is absorbed by blood. It has minimum scatter and provides great contrast and a good overall view of the fundus.
Figure 1. Standard 7-field Early Treatment of Diabetic Retinopathy Study (ETDRS) fields.
Fluorescein angiography (FA)
FA uses the same optical principles of fundus photography but also uses the fluorescence property of fluorescein sodium: absorption of light at shorter wavelengths and re-emission at higher wavelengths. Fluorescein sodium is excited by blue light (wavelength 465-490 nm) and re-emits yellow-green light (wavelength 520-530 nm). The camera has a blue filter that only allows the blue light to enter the eye. Some of this blue light is reflected off the retina back to the camera, and some of it excites the fluorescein sodium inside the blood vessels or elsewhere in the retina. The re-emitted yellow-green fluorescent light along with the reflected blue light re-enters the camera and passes through a yellow-green filter before it is recorded in a grey scale. Therefore, any re-emitted yellow-green light is recorded as bright by the camera and other colours will be recorded as dark.[6] Confocal scanning laser ophthalmoscopy (cSLO), used by devices such as Heidelberg Spectralis® HRA and Optos® 200Tx systems, uses monochromatic laser light (instead of flash light) to excite fluorescein sodium molecules and confocal image capturing for enhanced focusing. This significantly increases image resolution and reduces artifacts associated with flash-based FA, such as short wavelength scatter and autofluorescence from the crystalline lens.[5,7] Ultra wide-angle FA has the advantage of capturing pathology beyond the equator. Optos cameras can capture images as wide as 200° (centred on the mid-vitreous; (Figure 2A). Heidelberg systems with contact or noncontact lens accessories can also capture images as wide as 150° (Figure 2B).
Figure 2. Wide-angle fluorescein angiography (FA) images of 2 patients with proliferative sickle cell retinopathy. A: Optos® device. B: Heidelberg Spectralis® with the Staurenghi lens. Areas enclosed in dashed lines represent retinal neovascularization. The area enclosed in the solid line (2B) represents peripheral ischemia.


In all modalities, hyperfluorescence would indicate any of these scenarios: 1) leakage of the dye (eg, leakage from microaneurysms in DR); 2) pooling of the dye (eg, in pigment epithelial detachments [PEDs]); 3) RPE window defects allowing more pronounced fluorescence of choroid and sclera (eg, geographic atrophy in age-related macular degeneration [AMD]); or 4) staining of structures with the dye (eg, staining of drusen in AMD). In contrast, hypofluorescence would indicate either tissue hypoperfusion (eg, macular ischemia in DR) or blockage of fluorescent light (eg, presence of epiretinal hemorrhage in DR).
Indocyanine green angiography (ICGA)
ICG absorbs and emits light in the near infrared spectrum: its maximum absorption is at 790 nm and its maximum emission is at 835 nm. ICGA is an ideal method of imaging choroidal pathology since the dye allows for visualization through the RPE, retinal xanthophyll, and retinal fluid spaces (Figure 3). In addition, its high molecular weight (774.96 Da) and high plasma-bound portion (98%) lead to minimal leakage of the dye from healthy fenestrated choroidal vessels. Therefore, choroidal hyperfluorescent areas in ICGA (plaques or hot spots) usually indicate pathology.[6]
Figure 3. Indocyanine green angiography demonstrating a subretinal pigment epithelium (RPE) choroidal neovascular (CNV) lesion (circled in dashed line). Reproduced with permission from Ryan SJ. Retina. 5th ed. Philadelphia (PA): Elsevier Saunders; 2013. Copyright © 2013. Elsevier Health Science Books.

Fundus autofluorescence (FAF)
FAF imaging is a method of imaging naturally or pathologically occurring lipofuscin granules (and other minor fluorophores) of the ocular fundus. Lipofuscin accumulation in RPE cells is a hallmark of aging. Excessive accumulation of lipofuscin marks many diseases that affect the RPE such as AMD or various forms of pattern dystrophy. Lipofuscin granules have autofluorescent properties, meaning that when stimulated by blue light, they emit fluorescent light in the green-yellow spectrum.[6] Similarly, near-infrared autofluorescence (NIA) uses other fundus fluorophores (such as melanin) that possess autofluorescence properties in the near-infrared spectrum.[8,9] Hence, both FAF and NIA provide noninvasive visualization of pathologic changes in the RPE (Figures 4A-4C).[10]
Figure 4. Multimodal imaging for dry age-related macular degeneration (AMD) with geographic atrophy of the RPE. A: FA. B: Fundus autofluorescence. C: Near-infrared autofluorescence. Used with permission from Kellner U et al. Retina. 2010;30(1):6-15.

Fundus cameras can be equipped with FAF imaging capability with relatively inexpensive filters to limit the excitation light in the blue spectrum and the emitted light in the orange-green spectrum. The technical challenge in FAF imaging using these cameras is the very low level of naturally occurring fluorescent light of the fundus compared to the intensity of fluorescent light emitted during FA as well as the interference from the natural autofluorescence of cataractous lenses. cSLOs (eg, Heidelberg Spectralis or Optos 200Tx) address these problems through use of a single low-energy laser wavelength to excite the fluorophores and appropriate filters for the emitted light. Use of confocal optics in cSLO systems also eliminates the problem of light scattering and secondary reflectance.[11]
Ultrasound imaging
Ultrasound uses acoustic waves with frequencies >20 kHz. Higher frequencies mean shorter wavelengths, which translate to less penetration into tissues but higher resolution of final images. The common B-scan ultrasound technology employed in retinal imaging typically uses frequencies of 8–10 MHz and penetrates to a depth of about 40 mm; however, its image resolution is only around 0.5–0.9 mm. By contrast, ultrasound biomicroscopy, which is used in detailed anterior segment imaging, uses frequencies of 20–50 MHz, has a depth of penetration of only 5–10 mm, and a resolution of 0.04 mm. Velocity of waves, their reflectivity, angle of incidence, and absorption by the medium all influence the final image. Velocity depends on the density of the conducting medium.
A-scan ultrasound uses a unidimensional depiction of sound reflectivity to infer information about axial length and ocular structures. Angle of incidence must be monitored exactly when deriving information from an A-scan image since an improperly positioned probe can lead to inaccurate axial length measurements. B-scan ultrasound uses a probe that sweeps along a plane to produces multiple A-scans on that plane. The result is a 2-dimensional ultrasound image of the eye that can be used to derive information about conditions such as ocular tumours, retinal detachments, retinal tears, vitreous hemorrhage, or posterior vitreous detachment.
Optical coherence tomography (OCT)
The advent of OCT has made a significant impact on retinal imaging and the entire practice of ophthalmology. OCT is based on the principle of low-coherence interferometry, meaning the interference of a reference light and the light that is back-reflected from tissues are used to construct images of retinal layers. These interference patterns are used to construct axial A-scans at each incident point. The combination of these A-scans is used to construct 2-dimensional B-scans, which are the images familiar to most users.[6]
OCT offers very-high-resolution retinal imaging that has allowed precise management and follow-up of many retinal diseases. Most commercial OCT machines offer an axial resolution of 5 µm and research instruments have even higher axial resolutions; however, the lateral resolution is limited by pupillary-induced diffraction of light and is around 20 µm.[12] Early OCT technology, known as time-domain OCT, used a single light detector and a moving mirror to construct each A-scan. This would limit the acquisition speed of the instrument to a few thousand A-scans per second. Spectral-domain (SD) OCT – also known as Fourier-domain OCT – offers significantly faster acquisition speeds through the use of an array of detectors and multiple wavelengths of light across a spectrum (hence the name “spectral-domain”). With this technology, up to 100 000 A-scans can be obtained per second. Most commercial SD-OCT instruments offer speeds of 27 000–40 000 A-scans/second.
Swept-source (SS) OCT uses a laser beam that sweeps across a range of wavelengths. These wavelengths are generally longer (~1 µm range) than those used in SD-OCT (~840 nm range), have deeper tissue penetration, and allow improved choroidal and scleral imaging. The photodiode receivers of SS-OCT machines are able to operate at very fast speeds, leading to short acquisition times. There are, however, a few trade-offs with SS-OCT technology. Since the image resolution is reduced with increasing wavelengths, SS-OCT images have slightly degraded resolution compared to SD-OCT images. Furthermore, increased absorption of longer wavelengths by water restricts the range of bandwidths that can be used by SS-OCT, which further limits image resolution.[6,13]
OCT angiography (OCT-A) is a transformative extension of the OCT technology that uses motion contrast to image retinal and choroidal blood flow without the use of a contrast agent. The basis of OCT-A is to repeatedly scan an area and then examine sequential images for changes.[14] The resulting image looks like an angiogram, but has the advantages of short acquisition time (~3 seconds) and easy repeatability. In addition, OCT-A images provide 3-dimensional information about the location of the visualized structures, which allows clinicians to easily differentiate normal and abnormal superficial retinal, deep retinal, and choroidal microvasculature (Figures 5A-5D). However, unlike the traditional FA, OCT-A is unable to show vascular leakage. As a result, the clinician must deduce the leakage information from the retinal cystic changes on juxtaposed OCT images (Figures 5E, 5F). In addition, the current OCT-A technology is prone to image degradation due to eye movements, projection artifacts, and other factors.[14]
Figure 5. Optical coherence tomography (OCT) angiography of the left eye of a patient with neovascular AMD. A: Vascular of the superficial retina. B: Vasculature of the deep retina. C: Outer retina with traces of aberrant vasculature (this panel would normally be devoid of any vessels). D: Choriocapillaris layer showing the CNV membrane (encircled with dashed line). E,F: Juxtaposed OCT B scans demonstrating the intraretinal fluid as a result of the CNV. Images courtesy of Dr. David Chow, Toronto Retina Institute.

Imaging Modalities in Select Chronic Retinal Conditions
Macular holes
OCT is the primary imaging modality used in the diagnosis, management strategy, and follow-up of macular holes. In fact, the International Vitreomacular Traction Study Group has developed an entirely OCT-based anatomical classification system for different stages of vitreomacular traction (VMT) and macular holes.15 According to this classification, vitreomacular adhesion (VMA) is defined as perifoveal vitreous separation with remaining vitreomacular attachment that is not disturbing the foveal anatomy. This can lead to VMT, which is characterized by distortion of the foveal contour and may include pseudocysts, macular schisis, cystoid macular edema, or subretinal fluid. VMT can be subclassified based on OCT measurements into focal (£1500 µm) or broad (>1500 µm) vitreomacular attachment. A full-thickness macular hole (FTMH) is a foveal lesion characterized by interruption of retinal layers from internal limiting membrane to RPE.[15] FTMH can in turn be with or without VMT, which has implications on available treatment options (Figures 6A, 6B).
Figure 6. Examples of vitreomacular abnormalities imaged with OCT. A: Vitreomacular traction (VMT). B: Full-thickness macular hole with no residual VMT.


Chronic central serous chorioretinopathy (CSCR)
CSCR is a poorly understood condition that primarily affects young to middle-aged men. Exogenous steroids, stress, and “type A” personality are possible risk factors.[16,17] The pathophysiology of this condition is believed to involve the choriocapillaris and RPE, resulting in accumulation of subretinal fluid with decreased and distorted vision.[18] Multiple imaging modalities can be used to discern information about the characteristics of CSCR in each patient. The commonly used modalities are OCT, FA, and FAF. ICGA and OCT-A may also have a role in the management of this condition.
OCT is the primary imaging modality to diagnose and follow patients with CSCR (Figures 7A, 7B). The main OCT finding is the presence of subretinal fluid that usually involves the foveal centre. Other OCT findings include outer retinal and pigment epithelial irregularities such as PEDs. On occasion, intraretinal fluid is also seen on OCT images of chronic CSCR cases. The clinician has to rule out concurrent choroidal neovascular (CNV) membrane in these cases.
Figure 7. OCT of an eye with chronic central serous chorioretinopathy. A: Baseline. B: Moderate reduction of subretinal fluid 5 months after focal and micropulse laser treatment.


FA may be used to detect leaking RPE spots that cause the subretinal fluid. Identification of these spots supports the diagnosis and is also important for possible laser treatment (Figures 8A, 8B). Also, as previously mentioned, FA is used to rule out CNV in questionable or chronic cases. Identification of patches of RPE alterations outside the affected area or in the contralateral eye supports the diagnosis of CSCR.
Figure 8. FA of the right eye of a patient with chronic central serous chorioretinitis. A: Early phase of the angiogram showing a pinpoint early leakage (arrow). B: The later phase of the angiogram showing the smokestack appearance of the leakage point (arrows).


Classically, ICGA shows multiple areas of choroidal hyperpermeability in mid to late phases of the angiogram. These areas tend to surround the RPE leaks but may also be seen outside the leakage area and in the contralateral eye.[18] Identification of these spots is important for possible treatment of CSCR with full- or half-fluence photodynamic therapy.[19]
OCT-A is not a routine imaging method for the diagnosis of CSCR since it is unable to show leakage; however, new data suggest that abnormal choriocapillaris blood flow in CSCR can be visualized by OCT-A. Specifically, areas of reduced choriocapillaris blood flow surrounded by hyperperfused areas have been observed in chronic CSCR cases.[20]
Diabetic retinopathy (DR)
Pathophysiology of DR is related to capillary wall changes due to chronic hyperglycemia. These changes lead to vascular incompetence and chronic hypoxia and subsequent structural changes in the retina.
FA remains an important modality in documenting various pathological changes seen in DR. FA can document diffuse or focal vascular leakage in DR and can be used to guide focal macular laser for the treatment of diabetic macular edema. FA is also an important modality for the diagnosis of macular ischemia, which is identified as an expanded foveal avascular zone (FAZ). Furthermore, FA is routinely used to identify or confirm the presence of retinal neovascularization at the disc (NVD) or elsewhere (NVE) (Figure 9). Wide-angle FA is particularly useful for identification of peripheral areas of nonperfusion and retinal neovascularization, which can easily be missed in clinical examination.
Figure 9. Ultra-wide-angle FA (using Optos®) of an eye with proliferative diabetic retinopathy demonstrating multiple areas of retinal neovascularization and diffuse macular leakage.

OCT as a noninvasive diagnostic tool is used for routine follow-up of patients with DR. OCT is particularly useful for documentation and follow-up of diabetic macular edema, which is seen as macular thickening on OCT. On the other hand, excessive macular thinning (such as ganglion cell complex thinning) on OCT can be suggestive of macular ischemia.[21,22] OCT-A shows promise in documenting vascular changes of DR. OCT-A has been shown to document expansion and remodeling of FAZ, and vascular plexus remodeling in diabetic patients.[23-25]
Age-related macular degeneration (AMD)
AMD is a frequent cause of visual loss among older, particularly Caucasian, patients. Specific genetic risk alleles, lighter iris pigmentation, female sex, history of smoking, and history of sun exposure are other important risk factors.[26-28] AMD is generally divided into nonexudative (dry) and exudative (neovascular or wet) types, the latter being associated with CNV membranes. Multiple imaging modalities are used to document the status of AMD and, in particular, to differentiate exudative from nonexudative cases.
FA is the traditional imaging modality for documenting and characterizing the CNV lesions in exudative AMD. Based on the pattern of leakage in FA, CNV lesions can be characterized as classic or occult.[29] Classic CNV is characterized by early hyperfluorescence that increases in size and intensity in mid and late phases of the angiogram. Occult CNV encompasses 2 patterns of leakage: 1) fibrovascular PEDs, which appear as early defined areas of stippled hyperfluorescence that may or may not show leakage in the later phases of the angiogram (Figure 10); 2) late leakage of undetermined origin, which usually appears as poorly defined hyperfluorescence in mid or late phases of the angiogram (Figures 11A-11C). In the era of photodynamic therapy, classifying the CNV lesions into classic versus occult had significant implications for the treatment decisions. In the era of anti-vascular endothelial growth factor (VEGF) therapy, FA-guided classification of lesions into classic versus occult does not change the treatment paradigm anymore, but obtaining a baseline FA helps confirm the diagnosis of exudative AMD and is used to rule out other masquerading lesions (such as chronic CSCR).
Figure 10. Occult (type 1) CNV membrane. FA showing fibrovascular pigment epithelial detachments (PEDs) as early defined areas of stippled hyperfluorescence (circled in dashed line). Used with permission from Ryan SJ. Retina. 5th ed. Philadelphia (PA): Elsevier Saunders; 2013. Copyright© 2013. Elsevier Health Science Books

Figure 11. FA of an occult CNV membrane showing later leakage of undetermined source. A: Early phase with no apparent choroidal hyperfluorescence. B: Mid-phase showing mild hyperfluorescence temporal to fovea. C: Late phase showing hyperfluorescence temporal and nasal to fovea.


Figure 12. OCT of the eye imaged in Figure 11 showing the neovascular PED (red arrows) and intraretinal fluid (green arrows).
Although ICGA is no longer routinely used in AMD cases, it can further characterize the location of CNV lesions in exudative AMD. In particular, ICGA is very helpful in visualizing sub-RPE CNV lesions (also known as type 1 or occult; Figure 3)[29] or retinal angiomatous proliferation.
FAF can be useful for documentation and follow-up of geographic atrophy in dry AMD. Geographic atrophy will appear as dark (hypoautofluorescence) areas in FAF images, which can be used for serial documentation of these lesions.
OCT has become the primary imaging modality for diagnosis and follow-up of both dry and wet AMD. OCT can document pigment epithelial and retinal atrophy in dry AMD and is particularly useful for documenting manifestations of exudative AMD, including PEDs, intraretinal and subretinal fluid, and retinal thickness/volume.[30] It can also show hemorrhages and CNV lesions (Figure 12).[31] In follow-up of patients with exudative AMD, most clinicians use the presence of subretinal or intraretinal fluid in OCT as objective evidence of lesion activity. OCT-A provides a novel method of visualizing the neovascular membranes in wet AMD.[32] These lesions have been described as medusa (ie, branching in all directions from the centre of the lesion) or seafan (ie, branching to one side of the lesion from a stem).[33] Serial OCT-A scans can be used to document response to anti-VEGF therapy and it has been documented that the size and vessel density are reduced with anti-VEGF therapy (Figures 13A-13E).[34]

Figure 13. CNV membrane response to anti-vascular endothelial growth factor injection imaged with OCT angiography (OCT-A). A-D: Rapid shrinking and disappearance of the CNV complex in response to monthly ranibizumab injections. E: Reappearance of the CNV complex after the treatment interval is extended to 6 weeks. The lower panes represent to OCT B scans of the corresponding OCT-A images. Images courtesy of Dr. David Chow, Toronto Retina Institute.

Sickle cell retinopathy (SCR)
SCR constitutes a spectrum of proliferative and nonproliferative ischemic vascular changes seen in patients with sickle cell disease. Wide-angle FA is useful to identify and/or confirm peripheral neovascularization (NV) in SCR patients (Figures 2A, 2B), and can demonstrate areas of peripheral nonperfusion that could be sites of future NV.
Choroidal nevi and melanomas
Choroidal nevi are common posterior segment findings seen in up to 7.9% of Caucasian patients.[35] Identification of a nevus commonly raises the possibility of malignant transformation to a choroidal melanoma. Therefore, proper documentation of nevi with fundus photographs and ultrasound is important for detection of early malignant transformation. If available, FAF images are also helpful for documenting presence of overlying drusen, which is a favourable prognostic sign.
Documenting base diameter and height of choroidal nevi and melanomas is an important application of B-scan ultrasound for these conditions. These dimensions have important prognostic and treatment implications for these lesions according to Collaborate Ocular Melanoma Study (COMS) results.[36,37] In case of the lesion height, lesions with a height of ≥2.0 mm are generally considered small melanomas, and lesions <2.0 mm in height are generally considered nevi.[38,39] Acoustic hollowness (ie, low internal reflectivity in A-scan) is also more suggestive of melanoma than a nevus. However, documenting growth (or lack of) in serial photographs and ultrasound is the most important factor to differentiate a choroidal melanoma from a nevus.
Conclusion
The common imaging modalities used to document various retinal diseases range from traditional (eg, fundus photography) to more novel (eg, OCT angiography). These modalities can all enhance our understanding of common retinal diseases. Retinal imaging devices have been constantly advancing with steady technological improvements, and the use of multimodal imaging can greatly enhance our understanding of various retinal diseases.
Dr. Koushan is a retina specialist at Mount Sinai Hospital and Toronto Retina Institute. He is a faculty member of the Department of Ophthalmology and Vision Sciences, University of Toronto, and a Principal Investigator of the Diabetic Retinopathy Clinical Research Network.
References:
-
Jackman WT, Webster JD. On Photographing the Retina of the Living Human Eye. Philadelphia Photographer. 1886;xxiii(275):340-341.
-
Saine PJ, Tyler ME. Ophthalmic Photography: a Textbook of Fundus Photography, Angiography, and Electronic Imaging. Oxford (UK): Butterworth-Heinemann. 1997.
-
Ghajarnia M, Ho LY, Abdelghani WM, Eller AW, Friberg TR, Schwartz S. OPTOS Panaromic 200 imaging versus standard fundus photography in measurement of pigmented choroidal lesions. Invest Ophthalmol Vis Sci. 2007;48(13):1204.
-
Noble J, Silva PS, Cavallerano JD, et al. Comparison of nonmydriatic Optos® fundus imaging with mydriatic Early Treatment Diabetic Retinopathy Study (ETDRS) 7-standard field stereo photography and clinical grading. Invest Ophthalmol Vis Sci. 2011;52(14):1283.
-
Bennett TJ. Monochromatic fundus photography. Available at: http://www.opsweb.org/?page=Monochromatic. Accessed on January 27, 2016.
-
Ryan SJ, Schachat AP, Wilkinson CP, et al. Retina. 5th ed. Philadelphia (PA): Elsevier Saunders; 2013.
-
Yannuzzi LA, Ober MD, Slakter JS, et al. Ophthalmic fundus imaging: today and beyond. Am J Ophthalmol. 2004;137(3):511-524.
-
Schmitz-Valckenberg S, Lara D, Nizari S, et al. Localisation and significance of in vivo near-infrared autofluorescent signal in retinal imaging. Br J Ophthalmol. 2011;95(8):1134-1139.
-
Gibbs D, Cideciyan AV, Jacobson SG, Williams DS. Retinal pigment epithelium defects in humans and mice with mutations in MYO7A: imaging melanosome-specific autofluorescence. Invest Ophthalmol Vis Sci. 2009;50(9):4386-4393.
-
Kellner U, Kellner S, Weinitz S. Fundus autofluorescence (488 NM) and near-infrared autofluorescence (787 NM) visualize different retinal pigment epithelium alterations in patients with age-related macular degeneration. Retina. 2010;30(1):6-15.
-
Spaide RF. Fundus autofluorescence and age-related macular degeneration. Ophthalmology. 2003;110(2):392-399.
-
Gabriele ML, Wollstein G, Ishikawa H, et al. Optical coherence tomography: history, current status, and laboratory work. Invest Ophthalmol Vis Sci. 2011;52(5):2425-2436.
-
Mrejen S, Spaide RF. Optical coherence tomography: imaging of the choroid and beyond. Survey of Ophthalmology. 2013;58(5):387-429.
-
Spaide RF, Fujimoto JG, Waheed NK. Image artifacts in optical coherence tomography angiography. Retina. 2015;35(11):2163-2180.
-
Duker JS, Kaiser PK, Binder S, et al. The International Vitreomacular Traction Study Group classification of vitreomacular adhesion, traction, and macular hole. Ophthalmology. 2013;120(12):2611-2619.
-
Yannuzzi LA. Type-A behavior and central serous chorioretinopathy. Retina. 1987;7(2):111-131.
-
Zakir SM, Shukla M, Simi Z-U-R, Ahmad J, Sajid M. Serum cortisol and testosterone levels in idiopathic central serous chorioretinopathy. Indian J Ophthalmol. 2009;57(6):419-422.
-
Guyer DR, Yannuzzi LA, Slakter JS, Sorenson JA, Ho A, Orlock D. Digital indocyanine green videoangiography of central serous chorioretinopathy. Arch Ophthalmol. 1994;112(8):1057-1062.
-
Yannuzzi LA, Slakter JS, Gross NE, et al. Indocyanine green angiography-guided photodynamic therapy for treatment of chronic central serous chorioretinopathy: a pilot study. Retina. 2003;23(3): 288-298.
-
Teussink MM, Breukink MB, van Grinsven MJJP, et al. OCT angiography compared to fluorescein and indocyanine green angiography in chronic central serous chorioretinopathy. Invest Ophthalmol Vis Sci. 2015;56(9):5229-5237.
-
Cennamo G, Vecchio EC, Finelli M, Velotti N, de Crecchio G. Evaluation of ischemic diabetic maculopathy with Fourier-domain optical coherence tomography and microperimetry. Can J Ophthalmol. 2015;50(1):44-48.
-
Sim DA, Keane PA, Fung S, et al. Quantitative analysis of diabetic macular ischemia using optical coherence tomography. Invest Ophthalmol Vis Sci. 2014;55(1):417-423.
-
de Carlo TE, Chin AT, Bonini Filho MA, et al. Detection of microvascular changes in eyes of patients with diabetes but not clinical diabetic retinopathy using optical coherence tomography angiography. Retina. 2015;35(11):2364-2370.
-
Takase N, Nozaki M, Kato A, Ozeki H, Yoshida M, Ogura Y. Enlargement of foveal avascular zone in diabetic eyes evaluated by en face optical coherence tomography angiography. Retina. 2015;35(11): 2377-2383.
-
Couturier A, Mané V, Bonnin S, et al. Capillary plexus anomalies in diabetic retinopathy on optical coherence tomography angiography. Retina. 2015;35(11):2384-2391.
-
Schick T, Ersoy L, Lechanteur YTE, et al. History of sunlight exposure is a risk factor for age-related macular degeneration. Retina. Oct 5. [Epub ahead of print]
-
Joachim N, Mitchell P, Burlutsky G, Kifley A, Wang JJ. The incidence and progression of age-related macular degeneration over 15 years: the Blue Mountains Eye Study. Ophthalmology. 2015; 122(12):2482-2489.
-
Buitendijk GHS, Rochtchina E, Myers C, et al. Prediction of age-related macular degeneration in the general population: the Three Continent AMD Consortium. Ophthalmology. 2013;120(12):2644-2655.
-
Macular Photocoagulation Study Group. Subfoveal neovascular lesions in age-related macular degeneration: guidelines for evaluation and treatment in the macular photocoagulation study. Arch Ophthalmol. 1991;109(9):1242-1257.
-
Keane PA, Liakopoulos S, Ongchin SC, et al. Quantitative subanalysis of optical coherence tomography after treatment with ranibizumab for neovascular age-related macular degeneration. Invest Ophthalmol Vis Sci. 2008;49(7):3115-3120.
-
Framme C, Panagakis G, Birngruber R. Effects on choroidal neovascularization after anti-VEGF upload using intravitreal ranibizumab, as determined by spectral domain-optical coherence tomography. Invest Ophthalmol Vis Sci. 2010;51(3):1671-1676.
-
Jia Y, Bailey ST, Wilson DJ, et al. Quantitative optical coherence tomography angiography of choroidal neovascularization in age-related macular degeneration. Ophthalmology. 2014;121(7): 1435-1444.
-
Kuehlewein L, Bansal M, Lenis TL, et al. Optical coherence tomography angiography of type 1 neovascularization in age-related macular degeneration. Am J Ophthalmol. 2015;160(4):739-748.e2.
-
Kuehlewein L, Sadda SR, Sarraf D. OCT angiography and sequential quantitative analysis of type 2 neovascularization after ranibizumab therapy. Eye (Lond). 2015;29(7):932-935.
-
Singh AD, Kalyani P, Topham A. Estimating the risk of malignant transformation of a choroidal nevus. Ophthalmology. 2005; 112(10):1784-1789.
-
Diener-West M, Earle JD, Fine SL, et al; Collaborative . The COMS randomized trial of iodine 125 brachytherapy for choroidal melanoma, III: initial mortality findings: COMS Report No. 18. Arch Ophthalmol. 2001;119(7):969-982.
-
Hawkins BS; Collaborative Ocular Melanoma Study Group. The Collaborative Ocular Melanoma Study (COMS) randomized trial of pre-enucleation radiation of large choroidal melanoma: IV. Ten-year mortality findings and prognostic factors. COMS report number 24. Am J Ophthalmol. 2004;138(6):936-951.
-
The Collaborative Ocular Melanoma Study Group. Factors predictive of growth and treatment of small choroidal melanoma: COMS Report No. 5. Arch Ophthalmol. 1997;115(12):1537-1544.
-
Butler P, Char DH, Zarbin M, Kroll S. Natural history of indeterminate pigmented choroidal tumors. Ophthalmology. 1994;101(4): 710-716.
Disclosure Statement: Dr. Koushan has no disclosures to report in association with the contents of this issue.
Ophthalmology Rounds is made possible through educational support from